Combo Strategy 123 Reversal & Bill Williams Averages. 3Lines This is combo strategies for get
a cumulative signal. Result signal will return 1 if two strategies
is long, -1 if all strategies is short and 0 if signals of strategies is not equal.
First strategy
This System was created from the Book "How I Tripled My Money In The
Futures Market" by Ulf Jensen, Page 183. This is reverse type of strategies.
The strategy buys at market, if close price is higher than the previous close
during 2 days and the meaning of 9-days Stochastic Slow Oscillator is lower than 50.
The strategy sells at market, if close price is lower than the previous close price
during 2 days and the meaning of 9-days Stochastic Fast Oscillator is higher than 50.
Second strategy
This indicator calculates 3 Moving Averages for default values of
13, 8 and 5 days, with displacement 8, 5 and 3 days: Median Price (High+Low/2).
The most popular method of interpreting a moving average is to compare
the relationship between a moving average of the security's price with
the security's price itself (or between several moving averages).
WARNING:
- For purpose educate only
- This script to change bars colors.
In den Scripts nach "moving averages" suchen
Adaptive Convergence Divergence### Adaptive Convergence Divergence (ACD)
By Gurjit Singh
The Adaptive Convergence Divergence (ACD) reimagines the classic MACD by replacing fixed moving averages with adaptive moving averages. Instead of a static smoothing factor, it dynamically adjusts sensitivity based on price momentum, relative strength, volatility, fractal roughness, or volume pressure. This makes the oscillator more responsive in trending markets while filtering noise in choppy ranges.
#### 📌 Key Features
1. Dual Adaptive Structure: The oscillator uses two adaptive moving averages to form its convergence-divergence line, with EMA/RMA as signal line:
* Primary Adaptive (MA): Fast line, reacts quickly to changes.
* Following Adaptive (FAMA): Slow line, with half-alpha smoothing for confirmation.
2. Adaptive MA Types
* ACMO: Adaptive CMO (momentum)
* ARSI: Adaptive RSI (relative strength)
* FRMA: Fractal Roughness (volatility + fractal dimension)
* VOLA: Volume adaptive (volume pressure)
3. PPO Option: Switch between classic MACD or Percentage Price Oscillator (PPO) style calculation.
4. Signal Smoothing: Choose between EMA or Wilder’s RMA.
5. Visuals: Colored oscillator, signal line, histogram with adaptive transparency.
6. Alerts: Bullish/Bearish crossovers built-in.
#### 🔑 How to Use
1. Add to chart: Works on any timeframe and asset.
2. Choose MA Type: Experiment with ACMO, ARSI, FRMA, or VOLA depending on market regime.
3. Crossovers:
* Bullish (🐂): Oscillator crosses above signal → potential long entry.
* Bearish (🐻): Oscillator crosses below signal → potential short entry.
4. Histogram: expansion = strengthening trend; contraction = weakening trend.
5. Divergences:
* Bullish (hidden strength): Price pushes lower, but ACD turns higher = potential upward reversal.
* Bearish (hidden weakness): Price pushes higher, but ACD turns lower = potential downward reversal.
6. Customize: Adjust lengths, smoothing type, and PPO/MACD mode to match your style.
7. Set Alerts:
* Enable Bullish or Bearish crossover alerts to catch momentum shifts in real time.
#### 💡 Tips
* PPO mode normalizes values across assets, useful for cross-asset analysis.
* Wilder’s smoothing is gentler than EMA, reducing whipsaws in sideways conditions.
* Adaptive smoothing helps reduce false divergence signals by filtering noise in choppy ranges.

LMAsLibrary "LMAs"
Credits
Thank you to @QuantraSystems for dynamic calculations.
Introduction
This lightweight library offers dynamic implementations of popular moving averages that adapt their length automatically as new bars are added to the chart.
Each function is built on a dynamic length formula:
len = math.min(maxLength, bar_index + 1)
This approach ensures that calculations begin as early as the first bar, allowing for smoother initialization and more consistent behavior across all timeframes. It’s especially useful in custom scripts that run from bar 0 or when historical data is limited.
Usage
You can use this library as a drop-in replacement for standard moving averages. It provides more flexibility and stability in live or backtesting environments where fixed-length indicators may delay or fail to initialize properly.
Why Use This?
• Works from the very first bar
• Avoids na values during early bars
• Great for real-time indicators, strategies, and bar-replay
• Clean and efficient code with dynamic behavior
How to Use
Import the library into your script and call any of the included functions just like you would with their native counterparts.
Summary
A lightweight Pine Script™ library offering dynamic moving averages that work seamlessly from the very first bar. Ideal for strategies and indicators requiring robust initialization and adaptive behavior.
SMA(sourceData, maxLength)
Dynamic SMA
Parameters:
sourceData (float)
maxLength (int)
EMA(src, length)
Dynamic EMA
Parameters:
src (float)
length (int)
DEMA(src, length)
Dynamic DEMA
Parameters:
src (float)
length (int)
TEMA(src, length)
Dynamic TEMA
Parameters:
src (float)
length (int)
WMA(src, length)
Dynamic WMA
Parameters:
src (float)
length (int)
HMA(src, length)
Dynamic HMA
Parameters:
src (float)
length (int)
VWMA(src, volsrc, length)
Dynamic VWMA
Parameters:
src (float)
volsrc (float)
length (int)
SMMA(src, length)
Dynamic SMMA
Parameters:
src (float)
length (int)
LSMA(src, length, offset)
Dynamic LSMA
Parameters:
src (float)
length (int)
offset (int)
RMA(src, length)
Dynamic RMA
Parameters:
src (float)
length (int)
ALMA(src, length, offset_sigma, sigma)
Dynamic ALMA
Parameters:
src (float)
length (int)
offset_sigma (float)
sigma (float)
ZLSMA(src, length)
Dynamic ZLSMA
Parameters:
src (float)
length (int)
FRAMA(src, length)
Parameters:
src (float)
length (int)
KAMA(src, length)
Dynamic KAMA
Parameters:
src (float)
length (int)
JMA(src, length, phase)
Dynamic JMA
Parameters:
src (float)
length (int)
phase (float)
T3(src, length, volumeFactor)
Dynamic T3
Parameters:
src (float)
length (int)
volumeFactor (float)

NasyI## NasyI - Multi-Timeframe Technical Analysis Toolkit
### English Description
**NasyI** is a comprehensive technical analysis indicator designed to provide traders with a complete view of market dynamics across multiple timeframes. This indicator combines the power of Exponential Moving Averages (EMAs), Simple Moving Averages (MAs), Volume Weighted Average Price (VWAP), and key support/resistance levels to help traders identify trend direction, potential reversal points, and optimal entry/exit opportunities.
#### Key Features
1. **Multi-Timeframe Analysis System**
- 2-minute EMAs (13, 48) for ultra-short-term trend identification
- 5-minute EMAs (9, 13, 21, 48, 200) for short-term trend confirmation
- Daily EMAs (5, 13, 21, 48, 100, 200) and MAs (20, 50, 100, 200) for longer-term perspective
- Color-coded bands between key EMAs to visually identify trend strength and direction
2. **Advanced VWAP Integration**
- Daily VWAP for intraday support/resistance
- Weekly VWAP for medium-term price reference
- Monthly VWAP for long-term institutional price levels
- All VWAPs properly reset at their respective time period boundaries
3. **Critical Price Level Identification**
- Previous day high/low lines for identifying key breakout and breakdown levels
- Pre-market high/low tracking to identify potential intraday support/resistance zones
- All levels displayed with distinct line styles for easy identification
4. **Dynamic Trend Analysis**
- Color-coded bands between EMAs display trend strength and direction:
- Green bands indicate uptrend conditions (9 EMA > 21 EMA > 48 EMA)
- Red bands indicate downtrend conditions (9 EMA < 21 EMA < 48 EMA)
- Yellow bands indicate neutral/confused market conditions
- Visual representation makes trend changes immediately apparent
5. **Comprehensive Customization Options**
- Fully customizable colors for all indicators and bands
- Adjustable transparency settings for visual clarity
- Optional price labels with customizable placement and appearance
- Ability to show/hide specific components based on trading preferences
#### Trading Applications
This indicator is particularly valuable for:
1. **Day Trading & Scalping**: The 2-minute and 5-minute EMAs with color bands provide clear short-term trend direction and potential reversal signals.
2. **Swing Trading**: Daily EMAs and MAs offer perspective on the larger trend, helping to align short-term trades with the broader market direction.
3. **Gap Trading**: Previous day and pre-market levels help identify potential gap fill scenarios and breakout/breakdown opportunities.
4. **VWAP Trading Strategies**: Multiple timeframe VWAPs allow for identifying institutional participation levels and potential reversal zones.
5. **EMA Cross Systems**: The various EMAs can be used to identify golden crosses and death crosses across multiple timeframes.
#### How the Components Work Together
The power of NasyI comes from the integration of these different technical elements:
1. The short-timeframe EMAs (2m, 5m) provide immediate trend information, while the daily EMAs/MAs provide context about the larger market structure.
2. The color bands between EMAs offer instant visual confirmation of trend alignment or divergence across timeframes.
3. Previous day and pre-market levels add horizontal support/resistance zones to complement the dynamic moving averages.
4. Multiple timeframe VWAPs provide additional confirmation of institutional activity levels and potential reversal points.
By combining these elements, traders can develop a comprehensive market view that integrates price action, trend direction, and key support/resistance levels all in one indicator.
#### Usage Instructions
1. Apply the NasyI indicator to your chart (works best on intraday timeframes from 1-minute to 30-minute).
2. Observe the relationship between price and the various EMAs:
- Price above the 2m/5m EMAs with green bands indicates bullish short-term conditions
- Price below the 2m/5m EMAs with red bands indicates bearish short-term conditions
3. Use the daily EMAs/MAs and VWAPs as targets for potential price movements and reversal zones.
4. Previous day and pre-market high/low lines provide key levels to watch for breakouts or breakdowns.
5. Customize the appearance according to your preferences using the extensive settings options.
This indicator represents a unique approach to technical analysis by combining multiple timeframe perspectives into a single, visually intuitive display that helps traders make more informed decisions based on a comprehensive view of market conditions.
### 中文描述
**NasyI** 是一个全面的技术分析指标,旨在为交易者提供跨多个时间周期的完整市场动态视图。该指标结合了指数移动平均线(EMA)、简单移动平均线(MA)、成交量加权平均价格(VWAP)和关键支撑/阻力水平的力量,帮助交易者识别趋势方向、潜在反转点和最佳进出场机会。
#### 主要特点
1. **多时间周期分析系统**
- 2分钟EMAs(13,48)用于超短期趋势识别
- 5分钟EMAs(9,13,21,48,200)用于短期趋势确认
- 日线EMAs(5,13,21,48,100,200)和MAs(20,50,100,200)用于更长期的视角
- 关键EMAs之间的彩色带状区域直观显示趋势强度和方向
2. **高级VWAP整合**
- 日内VWAP作为日内支撑/阻力
- 周内VWAP作为中期价格参考
- 月内VWAP作为长期机构价格水平
- 所有VWAP在各自的时间周期边界正确重置
3. **关键价格水平识别**
- 前一交易日高点/低点线用于识别关键突破和跌破水平
- 盘前高点/低点跟踪用于识别潜在的日内支撑/阻力区域
- 所有水平以不同的线条样式显示,便于识别
4. **动态趋势分析**
- EMAs之间的彩色带状区域显示趋势强度和方向:
- 绿色带状区域表示上升趋势(9 EMA > 21 EMA > 48 EMA)
- 红色带状区域表示下降趋势(9 EMA < 21 EMA < 48 EMA)
- 黄色带状区域表示中性/混乱市场条件
- 视觉表示使趋势变化立即显现
5. **全面的自定义选项**
- 所有指标和带状区域的颜色完全可定制
- 可调节的透明度设置,提高视觉清晰度
- 可选的价格标签,带有可定制的位置和外观
- 能够根据交易偏好显示/隐藏特定组件
#### 交易应用
此指标对以下方面特别有价值:
1. **日内交易和短线交易**:2分钟和5分钟EMAs与色带提供清晰的短期趋势方向和潜在反转信号。
2. **摇摆交易**:日线EMAs和MAs提供对更大趋势的视角,帮助将短期交易与更广泛的市场方向对齐。
3. **缺口交易**:前一日和盘前水平帮助识别潜在的缺口填充情况和突破/跌破机会。
4. **VWAP交易策略**:多时间周期VWAP允许识别机构参与水平和潜在反转区域。
5. **EMA交叉系统**:各种EMAs可用于识别跨多个时间周期的黄金交叉和死亡交叉。
#### 组件如何协同工作
NasyI的强大之处在于这些不同技术元素的集成:
1. 短时间周期EMAs(2m,5m)提供即时趋势信息,而日线EMAs/MAs提供关于更大市场结构的背景。
2. EMAs之间的色带提供趋势对齐或跨时间周期分歧的即时视觉确认。
3. 前一日和盘前水平添加水平支撑/阻力区域,补充动态移动平均线。
4. 多时间周期VWAP提供机构活动水平和潜在反转点的额外确认。
通过结合这些元素,交易者可以发展出全面的市场视图,整合价格行动、趋势方向和关键支撑/阻力水平于一个指标中。
#### 使用说明
1. 将NasyI指标应用到您的图表上(最适合1分钟至30分钟的日内时间周期)。
2. 观察价格与各种EMAs之间的关系:
- 价格位于2m/5m EMAs之上,带有绿色带状区域,表示看涨的短期条件
- 价格位于2m/5m EMAs之下,带有红色带状区域,表示看跌的短期条件
3. 使用日线EMAs/MAs和VWAPs作为潜在价格移动和反转区域的目标。
4. 前一日和盘前高点/低点线提供需要关注的突破或跌破的关键水平。
5. 使用广泛的设置选项根据您的偏好自定义外观。
这个指标代表了一种独特的技术分析方法,将多个时间周期的视角结合到一个单一的、视觉直观的显示中,帮助交易者基于对市场条件的全面视图做出更明智的决策。

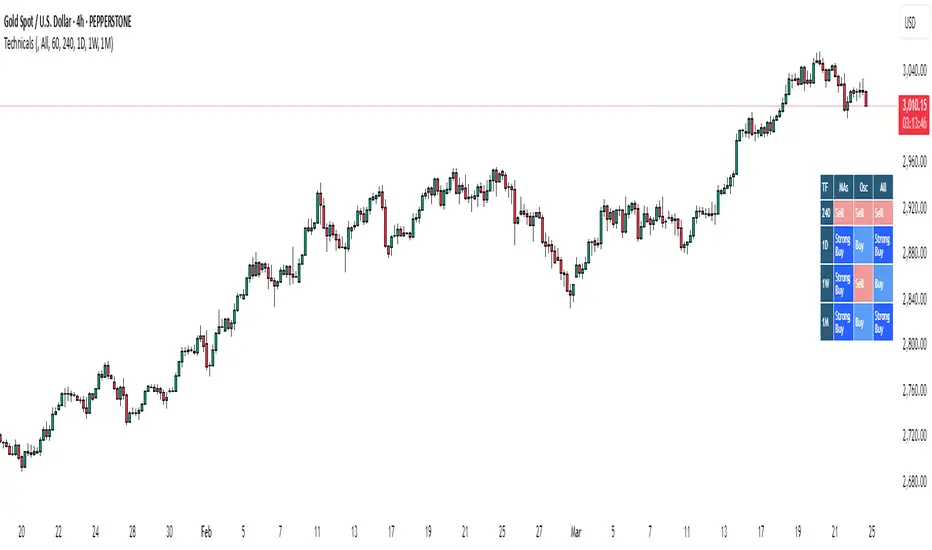
Bias TableOverview
The Bias Table Indicator is a multi-timeframe analysis tool designed to provide a quick sentiment overview across multiple timeframes. It combines signals from Moving Averages (MAs) and Oscillators to determine market bias, helping traders make more informed decisions.
Key Features
✔ Multi-Timeframe Analysis (MTF) – Displays market bias across up to five timeframes.
✔ Customizable Signals – Choose whether bias is based on Moving Averages (MAs), Oscillators, or a combination of both.
✔ Visual Table Format – The indicator presents the bias as a color-coded table in the bottom-right corner of the chart for quick reference.
✔ Adjustable Colors & Display Settings – Users can customize colors for different sentiment states (Strong Buy, Buy, Neutral, Sell, Strong Sell).
How It Works
Bias Calculation: The indicator evaluates market conditions using preset values (which can be replaced with actual logic) to determine sentiment for each timeframe.
Multi-Timeframe Support: The table can display bias from hourly to monthly timeframes, giving traders a broader view of market conditions.
Customizable Signals: Users can filter the table to show bias based only on MAs, Oscillators, or a combination of both.
Interpreting the Table
📊 Timeframes: The leftmost column shows selected timeframes (e.g., 1H, 4H, 1D, 1W, 1M).
📈 Signal Columns:
MAs – Bias based on Moving Averages.
Oscillators – Bias based on momentum indicators like RSI, Stochastics, etc.
All – A combined bias based on both MAs & Oscillators.
🚦 Color-Coded Ratings:
🔵 Strong Buy – High bullish strength.
🔹 Buy – Moderate bullish sentiment.
⚪ Neutral – No clear trend.
🔸 Sell – Moderate bearish sentiment.
🔴 Strong Sell – High bearish strength.
Best Used For:
📈 Trend Confirmation: Validate signals from your primary strategy.
⏳ Multi-Timeframe Analysis: See whether short-term and long-term trends align.
⚡ Quick Sentiment Check: Get a high-level view of market conditions without analyzing multiple indicators separately.
Customization Options:
Select which timeframes to include in the table.
Choose whether to base bias on MAs, Oscillators, or both.
Adjust colors for each signal type.
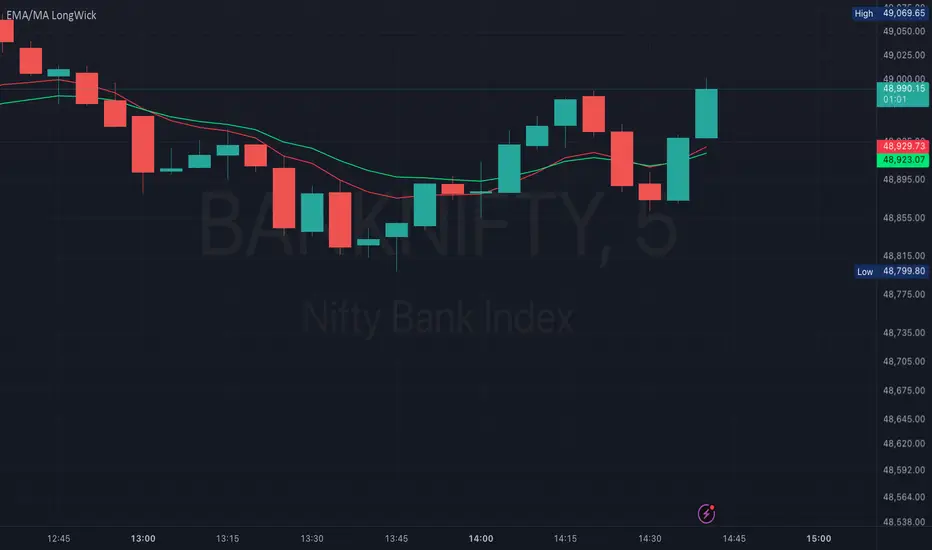
EMA/MA with OHCL Candle and Long Wick – A Comprehensive Trading
Dear Traders,
I am excited to introduce EMA/MA with OHCL Candle and Long Wick, a powerful trading indicator designed to enhance market analysis by combining Exponential Moving Averages (EMA), Simple Moving Averages (MA), OHCL candle patterns, and long wick detection into a single tool.
Key Features:
✅ Customizable Wick Size & Timeframe – Adapt the indicator to different market conditions by adjusting wick size and analyzing price action over any timeframe.
✅ EMA & MA for Trend Analysis – Includes multiple EMAs and MAs (5, 9, 15, 20, 50, 100, 200) to help identify trends and potential reversals.
✅ Long Wick Signal Detection – Identifies strong Buy and Sell opportunities based on wick size, signaling potential market turning points.
✅ OHCL Candle Analysis – Highlights OHCL patterns to provide additional insights into price action.
✅ User-Friendly & Lightweight – Efficiently coded for seamless performance on TradingView.
This indicator is perfect for traders looking to refine their entry and exit strategies by leveraging price action and moving averages. Whether you're a scalper, day trader, or swing trader, this tool provides valuable insights to enhance your decision-making.
Give it a try, and let me know your feedback! 🚀
Best regards,
Purnendu Singh
AO/AC Trading Zones Strategy [Skyrexio] Overview
AO/AC Trading Zones Strategy leverages the combination of Awesome Oscillator (AO), Acceleration/Deceleration Indicator (AC), Williams Fractals, Williams Alligator and Exponential Moving Average (EMA) to obtain the high probability long setups. Moreover, strategy uses multi trades system, adding funds to long position if it considered that current trend has likely became stronger. Combination of AO and AC is used for creating so-called trading zones to create the signals, while Alligator and Fractal are used in conjunction as an approximation of short-term trend to filter them. At the same time EMA (default EMA's period = 100) is used as high probability long-term trend filter to open long trades only if it considers current price action as an uptrend. More information in "Methodology" and "Justification of Methodology" paragraphs. The strategy opens only long trades.
Unique Features
No fixed stop-loss and take profit: Instead of fixed stop-loss level strategy utilizes technical condition obtained by Fractals and Alligator to identify when current uptrend is likely to be over. In some special cases strategy uses AO and AC combination to trail profit (more information in "Methodology" and "Justification of Methodology" paragraphs)
Configurable Trading Periods: Users can tailor the strategy to specific market windows, adapting to different market conditions.
Multilayer trades opening system: strategy uses only 10% of capital in every trade and open up to 5 trades at the same time if script consider current trend as strong one.
Short and long term trend trade filters: strategy uses EMA as high probability long-term trend filter and Alligator and Fractal combination as a short-term one.
Methodology
The strategy opens long trade when the following price met the conditions:
1. Price closed above EMA (by default, period = 100). Crossover is not obligatory.
2. Combination of Alligator and Williams Fractals shall consider current trend as an upward (all details in "Justification of Methodology" paragraph)
3. Both AC and AO shall print two consecutive increasing values. At the price candle close which corresponds to this condition algorithm opens the first long trade with 10% of capital.
4. If combination of Alligator and Williams Fractals shall consider current trend has been changed from up to downtrend, all long trades will be closed, no matter how many trades has been opened.
5. If AO and AC both continue printing the rising values strategy opens the long trade on each candle close with 10% of capital while number of opened trades reaches 5.
6. If AO and AC both has printed 5 rising values in a row algorithm close all trades if candle's low below the low of the 5-th candle with rising AO and AC values in a row.
Script also has additional visuals. If second long trade has been opened simultaneously the Alligator's teeth line is plotted with the green color. Also for every trade in a row from 2 to 5 the label "Buy More" is also plotted just below the teeth line. With every next simultaneously opened trade the green color of the space between teeth and price became less transparent.
Strategy settings
In the inputs window user can setup strategy setting:
EMA Length (by default = 100, period of EMA, used for long-term trend filtering EMA calculation).
User can choose the optimal parameters during backtesting on certain price chart.
Justification of Methodology
Let's explore the key concepts of this strategy and understand how they work together. We'll begin with the simplest: the EMA.
The Exponential Moving Average (EMA) is a type of moving average that assigns greater weight to recent price data, making it more responsive to current market changes compared to the Simple Moving Average (SMA). This tool is widely used in technical analysis to identify trends and generate buy or sell signals. The EMA is calculated as follows:
1.Calculate the Smoothing Multiplier:
Multiplier = 2 / (n + 1), Where n is the number of periods.
2. EMA Calculation
EMA = (Current Price) × Multiplier + (Previous EMA) × (1 − Multiplier)
In this strategy, the EMA acts as a long-term trend filter. For instance, long trades are considered only when the price closes above the EMA (default: 100-period). This increases the likelihood of entering trades aligned with the prevailing trend.
Next, let’s discuss the short-term trend filter, which combines the Williams Alligator and Williams Fractals. Williams Alligator
Developed by Bill Williams, the Alligator is a technical indicator that identifies trends and potential market reversals. It consists of three smoothed moving averages:
Jaw (Blue Line): The slowest of the three, based on a 13-period smoothed moving average shifted 8 bars ahead.
Teeth (Red Line): The medium-speed line, derived from an 8-period smoothed moving average shifted 5 bars forward.
Lips (Green Line): The fastest line, calculated using a 5-period smoothed moving average shifted 3 bars forward.
When the lines diverge and align in order, the "Alligator" is "awake," signaling a strong trend. When the lines overlap or intertwine, the "Alligator" is "asleep," indicating a range-bound or sideways market. This indicator helps traders determine when to enter or avoid trades.
Fractals, another tool by Bill Williams, help identify potential reversal points on a price chart. A fractal forms over at least five consecutive bars, with the middle bar showing either:
Up Fractal: Occurs when the middle bar has a higher high than the two preceding and two following bars, suggesting a potential downward reversal.
Down Fractal: Happens when the middle bar shows a lower low than the surrounding two bars, hinting at a possible upward reversal.
Traders often use fractals alongside other indicators to confirm trends or reversals, enhancing decision-making accuracy.
How do these tools work together in this strategy? Let’s consider an example of an uptrend.
When the price breaks above an up fractal, it signals a potential bullish trend. This occurs because the up fractal represents a shift in market behavior, where a temporary high was formed due to selling pressure. If the price revisits this level and breaks through, it suggests the market sentiment has turned bullish.
The breakout must occur above the Alligator’s teeth line to confirm the trend. A breakout below the teeth is considered invalid, and the downtrend might still persist. Conversely, in a downtrend, the same logic applies with down fractals.
In this strategy if the most recent up fractal breakout occurs above the Alligator's teeth and follows the last down fractal breakout below the teeth, the algorithm identifies an uptrend. Long trades can be opened during this phase if a signal aligns. If the price breaks a down fractal below the teeth line during an uptrend, the strategy assumes the uptrend has ended and closes all open long trades.
By combining the EMA as a long-term trend filter with the Alligator and fractals as short-term filters, this approach increases the likelihood of opening profitable trades while staying aligned with market dynamics.
Now let's talk about the trading zones concept and its signals. To understand this we need to briefly introduce what is AO and AC. The Awesome Oscillator (AO), developed by Bill Williams, is a momentum indicator designed to measure market momentum by contrasting recent price movements with a longer-term historical perspective. It helps traders detect potential trend reversals and assess the strength of ongoing trends.
The formula for AO is as follows:
AO = SMA5(Median Price) − SMA34(Median Price)
where:
Median Price = (High + Low) / 2
SMA5 = 5-period Simple Moving Average of the Median Price
SMA 34 = 34-period Simple Moving Average of the Median Price
The Acceleration/Deceleration (AC) Indicator, introduced by Bill Williams, measures the rate of change in market momentum. It highlights shifts in the driving force of price movements and helps traders spot early signs of trend changes. The AC Indicator is particularly useful for identifying whether the current momentum is accelerating or decelerating, which can indicate potential reversals or continuations. For AC calculation we shall use the AO calculated above is the following formula:
AC = AO − SMA5(AO) , where SMA5(AO)is the 5-period Simple Moving Average of the Awesome Oscillator
When the AC is above the zero line and rising, it suggests accelerating upward momentum.
When the AC is below the zero line and falling, it indicates accelerating downward momentum.
When the AC is below zero line and rising it suggests the decelerating the downtrend momentum. When AC is above the zero line and falling, it suggests the decelerating the uptrend momentum.
Now let's discuss the trading zones concept and how it can create the signal. Zones are created by the combination of AO and AC. We can divide three zone types:
Greed zone: when the AO and AC both are rising
Red zone: when the AO and AC both are decreasing
Gray zone: when one of AO or AC is rising, the other is falling
Gray zone is considered as uncertainty. AC and AO are moving in the opposite direction. Strategy skip such price action to decrease the chance to stuck in the losing trade during potential sideways. Red zone is also not interesting for the algorithm because both indicators consider the trend as bearish, but strategy opens only long trades. It is waiting for the green zone to increase the chance to open trade in the direction of the potential uptrend. When we have 2 candles in a row in the green zone script executes a long trade with 10% of capital.
Two green zone candles in a row is considered by algorithm as a bullish trend, but now so strong, that's the reason why trade is going to be closed when the combination of Alligator and Fractals will consider the the trend change from bullish to bearish. If id did not happens, algorithm starts to count the green zone candles in a row. When we have 5 in a row script change the trade closing condition. Such situation is considered is a high probability strong bull market and all trades will be closed if candle's low will be lower than fifth green zone candle's low. This is used to increase probability to secure the profit. If long trades are initiated, the strategy continues utilizing subsequent signals until the total number of trades reaches a maximum of 5. Each trade uses 10% of capital.
Why we use trading zones signals? If currently strategy algorithm considers the high probability of the short-term uptrend with the Alligator and Fractals combination pointed out above and the long-term trend is also suggested by the EMA filter as bullish. Rising AC and AO values in the direction of the most likely main trend signaling that we have the high probability of the fastest bullish phase on the market. The main idea is to take part in such rapid moves and add trades if this move continues its acceleration according to indicators.
Backtest Results
Operating window: Date range of backtests is 2023.01.01 - 2024.12.31. It is chosen to let the strategy to close all opened positions.
Commission and Slippage: Includes a standard Binance commission of 0.1% and accounts for possible slippage over 5 ticks.
Initial capital: 10000 USDT
Percent of capital used in every trade: 10%
Maximum Single Position Loss: -9.49%
Maximum Single Profit: +24.33%
Net Profit: +4374.70 USDT (+43.75%)
Total Trades: 278 (39.57% win rate)
Profit Factor: 2.203
Maximum Accumulated Loss: 668.16 USDT (-5.43%)
Average Profit per Trade: 15.74 USDT (+1.37%)
Average Trade Duration: 60 hours
How to Use
Add the script to favorites for easy access.
Apply to the desired timeframe and chart (optimal performance observed on 4h BTC/USDT).
Configure settings using the dropdown choice list in the built-in menu.
Set up alerts to automate strategy positions through web hook with the text: {{strategy.order.alert_message}}
Disclaimer:
Educational and informational tool reflecting Skyrex commitment to informed trading. Past performance does not guarantee future results. Test strategies in a simulated environment before live implementation
These results are obtained with realistic parameters representing trading conditions observed at major exchanges such as Binance and with realistic trading portfolio usage parameters.

MultiLayer Acceleration/Deceleration Strategy [Skyrexio]Overview
MultiLayer Acceleration/Deceleration Strategy leverages the combination of Acceleration/Deceleration Indicator(AC), Williams Alligator, Williams Fractals and Exponential Moving Average (EMA) to obtain the high probability long setups. Moreover, strategy uses multi trades system, adding funds to long position if it considered that current trend has likely became stronger. Acceleration/Deceleration Indicator is used for creating signals, while Alligator and Fractal are used in conjunction as an approximation of short-term trend to filter them. At the same time EMA (default EMA's period = 100) is used as high probability long-term trend filter to open long trades only if it considers current price action as an uptrend. More information in "Methodology" and "Justification of Methodology" paragraphs. The strategy opens only long trades.
Unique Features
No fixed stop-loss and take profit: Instead of fixed stop-loss level strategy utilizes technical condition obtained by Fractals and Alligator to identify when current uptrend is likely to be over (more information in "Methodology" and "Justification of Methodology" paragraphs)
Configurable Trading Periods: Users can tailor the strategy to specific market windows, adapting to different market conditions.
Multilayer trades opening system: strategy uses only 10% of capital in every trade and open up to 5 trades at the same time if script consider current trend as strong one.
Short and long term trend trade filters: strategy uses EMA as high probability long-term trend filter and Alligator and Fractal combination as a short-term one.
Methodology
The strategy opens long trade when the following price met the conditions:
1. Price closed above EMA (by default, period = 100). Crossover is not obligatory.
2. Combination of Alligator and Williams Fractals shall consider current trend as an upward (all details in "Justification of Methodology" paragraph)
3. Acceleration/Deceleration shall create one of two types of long signals (all details in "Justification of Methodology" paragraph). Buy stop order is placed one tick above the candle's high of last created long signal.
4. If price reaches the order price, long position is opened with 10% of capital.
5. If currently we have opened position and price creates and hit the order price of another one long signal, another one long position will be added to the previous with another one 10% of capital. Strategy allows to open up to 5 long trades simultaneously.
6. If combination of Alligator and Williams Fractals shall consider current trend has been changed from up to downtrend, all long trades will be closed, no matter how many trades has been opened.
Script also has additional visuals. If second long trade has been opened simultaneously the Alligator's teeth line is plotted with the green color. Also for every trade in a row from 2 to 5 the label "Buy More" is also plotted just below the teeth line. With every next simultaneously opened trade the green color of the space between teeth and price became less transparent.
Strategy settings
In the inputs window user can setup strategy setting: EMA Length (by default = 100, period of EMA, used for long-term trend filtering EMA calculation). User can choose the optimal parameters during backtesting on certain price chart.
Justification of Methodology
Let's explore the key concepts of this strategy and understand how they work together. We'll begin with the simplest: the EMA.
The Exponential Moving Average (EMA) is a type of moving average that assigns greater weight to recent price data, making it more responsive to current market changes compared to the Simple Moving Average (SMA). This tool is widely used in technical analysis to identify trends and generate buy or sell signals. The EMA is calculated as follows:
1.Calculate the Smoothing Multiplier:
Multiplier = 2 / (n + 1), Where n is the number of periods.
2. EMA Calculation
EMA = (Current Price) × Multiplier + (Previous EMA) × (1 − Multiplier)
In this strategy, the EMA acts as a long-term trend filter. For instance, long trades are considered only when the price closes above the EMA (default: 100-period). This increases the likelihood of entering trades aligned with the prevailing trend.
Next, let’s discuss the short-term trend filter, which combines the Williams Alligator and Williams Fractals. Williams Alligator
Developed by Bill Williams, the Alligator is a technical indicator that identifies trends and potential market reversals. It consists of three smoothed moving averages:
Jaw (Blue Line): The slowest of the three, based on a 13-period smoothed moving average shifted 8 bars ahead.
Teeth (Red Line): The medium-speed line, derived from an 8-period smoothed moving average shifted 5 bars forward.
Lips (Green Line): The fastest line, calculated using a 5-period smoothed moving average shifted 3 bars forward.
When the lines diverge and align in order, the "Alligator" is "awake," signaling a strong trend. When the lines overlap or intertwine, the "Alligator" is "asleep," indicating a range-bound or sideways market. This indicator helps traders determine when to enter or avoid trades.
Fractals, another tool by Bill Williams, help identify potential reversal points on a price chart. A fractal forms over at least five consecutive bars, with the middle bar showing either:
Up Fractal: Occurs when the middle bar has a higher high than the two preceding and two following bars, suggesting a potential downward reversal.
Down Fractal: Happens when the middle bar shows a lower low than the surrounding two bars, hinting at a possible upward reversal.
Traders often use fractals alongside other indicators to confirm trends or reversals, enhancing decision-making accuracy.
How do these tools work together in this strategy? Let’s consider an example of an uptrend.
When the price breaks above an up fractal, it signals a potential bullish trend. This occurs because the up fractal represents a shift in market behavior, where a temporary high was formed due to selling pressure. If the price revisits this level and breaks through, it suggests the market sentiment has turned bullish.
The breakout must occur above the Alligator’s teeth line to confirm the trend. A breakout below the teeth is considered invalid, and the downtrend might still persist. Conversely, in a downtrend, the same logic applies with down fractals.
In this strategy if the most recent up fractal breakout occurs above the Alligator's teeth and follows the last down fractal breakout below the teeth, the algorithm identifies an uptrend. Long trades can be opened during this phase if a signal aligns. If the price breaks a down fractal below the teeth line during an uptrend, the strategy assumes the uptrend has ended and closes all open long trades.
By combining the EMA as a long-term trend filter with the Alligator and fractals as short-term filters, this approach increases the likelihood of opening profitable trades while staying aligned with market dynamics.
Now let's talk about Acceleration/Deceleration signals. AC indicator is calculated using the Awesome Oscillator, so let's first of all briefly explain what is Awesome Oscillator and how it can be calculated. The Awesome Oscillator (AO), developed by Bill Williams, is a momentum indicator designed to measure market momentum by contrasting recent price movements with a longer-term historical perspective. It helps traders detect potential trend reversals and assess the strength of ongoing trends.
The formula for AO is as follows:
AO = SMA5(Median Price) − SMA34(Median Price)
where:
Median Price = (High + Low) / 2
SMA5 = 5-period Simple Moving Average of the Median Price
SMA 34 = 34-period Simple Moving Average of the Median Price
The Acceleration/Deceleration (AC) Indicator, introduced by Bill Williams, measures the rate of change in market momentum. It highlights shifts in the driving force of price movements and helps traders spot early signs of trend changes. The AC Indicator is particularly useful for identifying whether the current momentum is accelerating or decelerating, which can indicate potential reversals or continuations. For AC calculation we shall use the AO calculated above is the following formula:
AC = AO − SMA5(AO), where SMA5(AO)is the 5-period Simple Moving Average of the Awesome Oscillator
When the AC is above the zero line and rising, it suggests accelerating upward momentum.
When the AC is below the zero line and falling, it indicates accelerating downward momentum.
When the AC is below zero line and rising it suggests the decelerating the downtrend momentum. When AC is above the zero line and falling, it suggests the decelerating the uptrend momentum.
Now we can explain which AC signal types are used in this strategy. The first type of long signal is when AC value is below zero line. In this cases we need to see three rising bars on the histogram in a row after the falling one. The second type of signals occurs above the zero line. There we need only two rising AC bars in a row after the falling one to create the signal. The signal bar is the last green bar in this sequence. The strategy places the buy stop order one tick above the candle's high, which corresponds to the signal bar on AC indicator.
After that we can have the following scenarios:
Price hit the order on the next candle in this case strategy opened long with this price.
Price doesn't hit the order price, the next candle set lower high. If current AC bar is increasing buy stop order changes by the script to the high of this new bar plus one tick. This procedure repeats until price finally hit buy order or current AC bar become decreasing. In the second case buy order cancelled and strategy wait for the next AC signal.
If long trades are initiated, the strategy continues utilizing subsequent signals until the total number of trades reaches a maximum of 5. All open trades are closed when the trend shifts to a downtrend, as determined by the combination of the Alligator and Fractals described earlier.
Why we use AC signals? If currently strategy algorithm considers the high probability of the short-term uptrend with the Alligator and Fractals combination pointed out above and the long-term trend is also suggested by the EMA filter as bullish. Rising AC bars after period of falling AC bars indicates the high probability of local pull back end and there is a high chance to open long trade in the direction of the most likely main uptrend. The numbers of rising bars are different for the different AC values (below or above zero line). This is needed because if AC below zero line the local downtrend is likely to be stronger and needs more rising bars to confirm that it has been changed than if AC is above zero.
Why strategy use only 10% per signal? Sometimes we can see the false signals which appears on sideways. Not risking that much script use only 10% per signal. If the first long trade has been open and price continue going up and our trend approximation by Alligator and Fractals is uptrend, strategy add another one 10% of capital to every next AC signal while number of active trades no more than 5. This capital allocation allows to take part in long trades when current uptrend is likely to be strong and use only 10% of capital when there is a high probability of sideways.
Backtest Results
Operating window: Date range of backtests is 2023.01.01 - 2024.11.01. It is chosen to let the strategy to close all opened positions.
Commission and Slippage: Includes a standard Binance commission of 0.1% and accounts for possible slippage over 5 ticks.
Initial capital: 10000 USDT
Percent of capital used in every trade: 10%
Maximum Single Position Loss: -5.15%
Maximum Single Profit: +24.57%
Net Profit: +2108.85 USDT (+21.09%)
Total Trades: 111 (36.94% win rate)
Profit Factor: 2.391
Maximum Accumulated Loss: 367.61 USDT (-2.97%)
Average Profit per Trade: 19.00 USDT (+1.78%)
Average Trade Duration: 75 hours
How to Use
Add the script to favorites for easy access.
Apply to the desired timeframe and chart (optimal performance observed on 3h BTC/USDT).
Configure settings using the dropdown choice list in the built-in menu.
Set up alerts to automate strategy positions through web hook with the text: {{strategy.order.alert_message}}
Disclaimer:
Educational and informational tool reflecting Skyrex commitment to informed trading. Past performance does not guarantee future results. Test strategies in a simulated environment before live implementation
These results are obtained with realistic parameters representing trading conditions observed at major exchanges such as Binance and with realistic trading portfolio usage parameters.

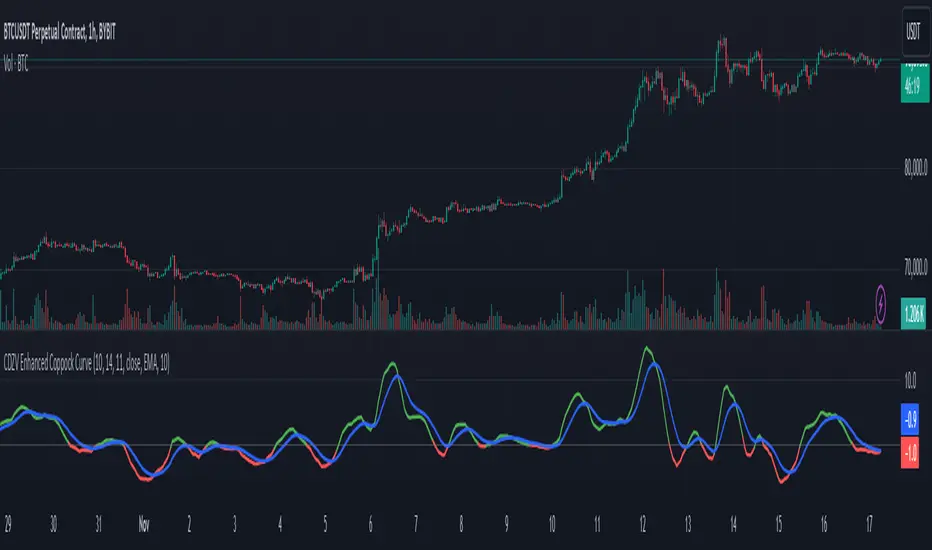
CDZV Enhanced Coppock CurveThis indicator is a part of the CDZV toolkit (backtesting and automation)
The Enhanced Coppock Curve is an upgraded version of the classic Coppock Curve indicator. It incorporates several additional features for greater flexibility and analysis capabilities. This indicator is used to analyze market trends by plotting a weighted moving average (WMA) of the sum of two Rate of Change (ROC) values.
Key Features of the Indicator:
Base Calculation of the Coppock Curve:
The Coppock Curve is calculated as a weighted moving average (WMA) of the sum of two ROC values (long and short periods).
The source for the calculation is customizable (default is close).
Added Custom Moving Average:
The indicator supports three types of moving averages:
EMA (Exponential Moving Average),
SMA (Simple Moving Average),
HMA (Hull Moving Average).
Users can choose the type and length of the moving average via input settings.
The selected moving average values are displayed in the Data Window for easier analysis.
Dynamic Coloring of the Coppock Curve:
The Coppock Curve line changes color based on its value:
Green if the value is positive,
Red if the value is negative.
The line's color is also displayed in the Data Window as a numeric value:
1 for green (positive),
-1 for red (negative).
Data Window Output:
The values of the selected moving average are displayed in the Data Window.
The Coppock Curve line's color state (1 or -1) is also shown in the Data Window.
Visual Representation:
The Coppock Curve is plotted with dynamic color coding.
The selected moving average is overlaid on the Coppock Curve for deeper trend analysis.
Usage Instructions:
Add the indicator to your chart on TradingView.
Configure the inputs:
Smoothing length for the Coppock Curve,
Long and short periods for ROC,
Type and length of the moving average.
Analyze the chart:
A green Coppock Curve line indicates a bullish trend, while a red line signals a bearish trend.
The selected moving average helps further filter and confirm signals.
Use the Data Window to view numeric values for the moving average and the Coppock Curve line color.
Applications:
This indicator is ideal for assessing trend direction and strength. The added customization options and additional data make it a versatile tool for traders, enabling them to tailor the Coppock Curve to their strategies.
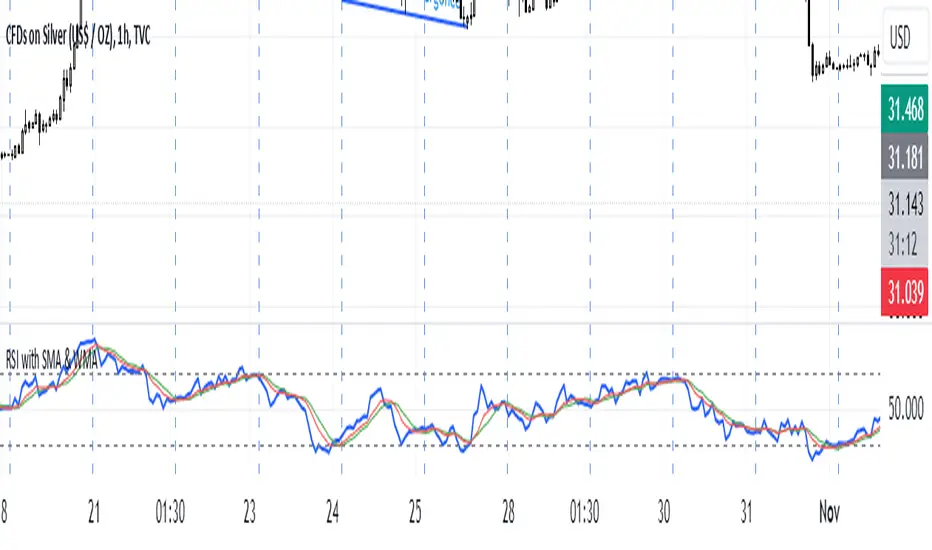
M.Kiriti RSI with SMA & WMAThis script is a custom RSI indicator with added SMA and WMA moving averages to smooth RSI trends and improve analysis of momentum shifts.
1. RSI Calculation: Measures 14-period RSI of the closing price, default threshold levels at 70 (overbought) and 30 (oversold).
2. Moving Averages (SMA and WMA):
- SMA and WMA are applied to RSI for trend smoothing.
- SMA gives equal weight; WMA gives more weight to recent values, making it more responsive.
3.Overbought/Oversold Lines and Labels:
- Horizontal lines and scale labels at 70 (overbought) and 30 (oversold) make these levels easy to reference.
This indicator is useful for identifying potential reversal points and momentum trends when RSI crosses its moving averages.
Bullish/Bearish Reversal Bars Indicator [Skyrexio]Introduction
Bullish/Bearish Reversal Bars Indicator leverages the combination of candlestick reversal bar pattern and the Williams Alligator indicator to help traders in understanding where there is a high probability of market reversal or correction. Indicator works for both bearish and bullish cases. It visualizes the bearish and bullish reversal bars with red and green dots and also plots the Alligator's lips to make it more convenient for traders to understand if price is above or below lips line (more information in "Methodology and it's justification" paragraph).
Features
Market Facilitation Index(MFI) filter: with the specified parameter in settings user can choose to filter bullish and bearish reversal bars which passed the MFI condition.
Awesome Oscillator(AO) filter: with the specified parameter in settings user can choose to filter bullish and bearish reversal bars which passed the AO condition.
Alerts: user can set up the alert and have notifications when bullish/bearish reversal bar has been printed.
Methodology and it's justification
In the script’s methodology, we apply the concepts of bullish and bearish reversal bars introduced by Bill Williams in his book Trading Chaos. So, what exactly is a bullish or bearish reversal bar? At its core, it’s a candlestick pattern. A bullish reversal bar is a bar that closes in its upper half, while a bearish reversal bar closes in its lower half.
Why is this type of bar significant? Let’s look at the bullish reversal bar as an example. When the price is trending upward, forming higher highs with each candle, and we suddenly see a bullish bar that makes a new high but ultimately closes in its lower half, it signals a shift in control. Bears have taken control toward the end of that candle's period, pushing the price back down. This can be interpreted as a sign of trend weakness and a potential reversal (or at least a correction).
An additional key point is that a reversal bar often indicates a possible end to the trend. Therefore, for a reversal bar to be valid, several preceding candles should show lower highs (for bullish bars) or higher lows (for bearish bars), reinforcing the likelihood of a trend change.
The second step on methodology is the location of the bar related to Williams Alligator. The Williams Alligator Indicator, developed by Bill Williams, is a technical analysis tool that helps traders identify trends and potential turning points in the market. It consists of three lines, often called the jaw, teeth, and lips of the alligator, each representing different moving averages:
Jaw (Blue Line): A slower moving average, typically a 13-period smoothed moving average shifted 8 bars into the future.
Teeth (Red Line): A medium moving average, typically an 8-period smoothed moving average shifted 5 bars into the future.
Lips (Green Line): A faster moving average, usually a 5-period smoothed moving average shifted 3 bars into the future.
When the three lines are spread out and moving in the same direction, it suggests a strong trend (the "alligator" is "awake and feeding"). When they intertwine, the indicator suggests that the market is moving sideways, or in a range, signaling a lack of clear trend (the "alligator" is "sleeping"). Traders use the Alligator Indicator to enter trades in trending markets and avoid trades in choppy, non-trending markets.
If bullish reversal bar's high is not below and bearish reversal bar's low is not above all three Alligator's lines (jaw, lips, teeth) they cannot be interpreted as these types of bars. It can be explained as following: if we are waiting for the bullish reversal bar it shall be reversal from downtrend. If price is not below all three lines it can't be interpret as the downtrend according to this method. The opposite is true for the bearish reversal bar.
All described above are obligatory conditions for reversal bar, now let's discuss two not obligatory conditions. The first one is Market Facilitation Index (MFI) restriction. Let's briefly look what is MFI. The Market Facilitation Index (MFI) is a technical indicator that measures the price movement per unit of volume, helping traders gauge the efficiency of price movement in relation to trading volume. Here's how you can calculate it:
MFI = (High−Low)/Volume
MFI can be used in combination with volume, so we can divide 4 states. Bill Williams introduced these to help traders interpret the interaction between volume and price movement. Here’s a quick summary:
Green Window (Increased MFI & Increased Volume): Indicates strong momentum with both price and volume increasing. Often a sign of trend continuation, as both buying and selling interest are rising.
Fake Window (Increased MFI & Decreased Volume): Shows that price is moving but with lower volume, suggesting weak support for the trend. This can signal a potential end of the current trend.
Squat Window (Decreased MFI & Increased Volume): Shows high volume but little price movement, indicating a tug-of-war between buyers and sellers. This often precedes a breakout as the pressure builds.
Fade Window (Decreased MFI & Decreased Volume): Indicates a lack of interest from both buyers and sellers, leading to lower momentum. This typically happens in range-bound markets and may signal consolidation before a new move.
For our purposes we are interested in squat bars. This is the sign that volume cannot move the price easily. This type of bar increases the probability of trend reversal. In this indicator we added to enable the MFI filter of reversal bars. If potential reversal bar or two preceding bars have squat state this bar can be interpret as a reversal one.
The second additional filter is Awesome Oscillator. The Awesome Oscillator (AO), developed by Bill Williams, is a momentum indicator that measures market momentum by comparing recent price action to a longer historical context. It helps traders identify potential trend reversals and the strength of trends. Formula:
AO = SMA5(Median Price) − SMA34(Median Price)
where:
Median Price = (High + Low) / 2
SMA5 = 5-period Simple Moving Average of the Median Price
SMA 34 = 34-period Simple Moving Average of the Median Price
If AO is decreasing momentum is bearish, if increasing - bullish. According to Bill Williams approach reversal bars are the potential trades against the trend. As a result we added second filter for bullish reversal bars AO shall be decreasing, for bearish increasing.
How to use indicator
Apply it to desired chart and time frame. It works on every time frame.
Setup the filters with the "Enable MFI" and "Enable AO" checkboxes in the settings. By default they are turned on.
Analyze the price action. Indicator plotted the white line, this is the lips of an Alligator. It will help you to understand how price is moving in comparison to lips line. Indicator will print the green dot and text "BULL" below it current bar is bullish reversal. It will print the red dot and text "BEAR" above it if current bar is interpreted by algorithm as a bearish reversal.
Set up the alerts if it's needed. Indicator has two custom alerts called "Bullish reversal bar has been printed" and "Bearish reversal bar has been printed"
Disclaimer:
Educational and informational tool reflecting Skyrex commitment to informed trading. Past performance does not guarantee future results. Test indicators before live implementation.

Landry Light with Moving AverageLandry Light with Moving Average
Overview:
This Pine Script, titled "Landry Light with Moving Average", visualizes the relationship between price action and a chosen moving average (MA) over time. It helps users easily identify periods where the price stays consistently above or below the moving average, which can be a useful indicator of bullish or bearish trends.
Key Features:
Moving Average Type Selection:
The script allows users to choose between two types of moving averages:
Exponential Moving Average (EMA)
Simple Moving Average (SMA)
This is done via a user input option, enabling traders to tailor the indicator to their preferred analysis method.
Moving Average Length:
Users can set the length of the moving average (default is 21 periods). This allows customization based on the trader's time frame, whether short-term or long-term analysis.
Dynamic Moving Average Color:
The moving average line changes color based on the relationship between the price and the MA:
Green: Price is consistently above the MA (bullish condition).
Red: Price is consistently below the MA (bearish condition).
Blue: Price is crossing or close to the MA (neutral or indecisive condition).
Cumulative Days Above/Below MA:
The script tracks and displays the number of consecutive days the price remains above or below the moving average:
Cumulative Days Above: Shown as a green histogram above the zero line.
Cumulative Days Below: Shown as a red histogram below the zero line.
This feature helps users identify sustained trends or potential reversals.
Real-time Labels:
The script generates dynamic labels that display the count of cumulative days the price has stayed above or below the moving average.
These labels are positioned near the moving average on the chart, providing an easy reference for traders.
How Users Can Benefit:
Trend Identification:
By visually representing how long the price stays above or below a key moving average, traders can identify strong bullish or bearish trends. This can inform entry and exit points.
Visualizing Market Sentiment:
The colored moving average line and histogram help traders quickly assess market sentiment. A prolonged green MA line suggests a strong uptrend, while a prolonged red line indicates a downtrend.
Adaptability:
With customizable moving average types and lengths, the indicator can be tailored to fit various trading strategies, whether for day trading, swing trading, or long-term investing.
Reversal Signals:
A shift from cumulative days above to cumulative days below (or vice versa) can serve as an early signal of a potential market reversal, allowing traders to adjust their positions accordingly.
Simplified Decision-Making:
The combination of visual cues (colors, histograms, and labels) simplifies decision-making, allowing traders to focus on trend strength rather than complex calculations.
Usage:
To use this script:
Add the Indicator to Your Chart:
Select the desired moving average type and length.
The script will plot the moving average, colored by the trend, and display cumulative days above or below it.
Interpret the Signals:
Use the histogram and labels to gauge the strength of the trend.
Monitor color changes in the moving average for potential trend reversals.
Incorporate into Your Strategy:
Combine this indicator with other tools (e.g., volume analysis, RSI) to confirm signals and refine your trading strategy.
This indicator is particularly useful for traders who follow the "Landry Light" concept, emphasizing the importance of price staying above or below a moving average to determine trend strength.

RSI-based MACDThe RSI is one of the most popular indicators available. This indicator, which represents the strength of market momentum based on the gains and losses over the past 14 candlesticks, is rational and is mainly used as an oscillator to determine overbought or oversold conditions. However, because the RSI is an older indicator, its very simple design—displaying only a single line on the graph—may feel somewhat lacking in functionality to modern traders. The main issue is that there is no objective measure to determine whether the RSI is currently rising or falling.
That’s when I came up with the idea of calculating the MACD based on the smoothed values of the RSI. As is well known, the MACD is an indicator that represents the distance between moving averages, designed to show when the moving averages cross as the value falls below zero. By observing the golden crosses and death crosses of the MACD and signal line, one can anticipate the golden and death crosses of the moving averages. Applying the same logic, I thought that calculating the MACD based on RSI values would allow us to predict the rise and fall of the RSI by observing these golden and death crosses.
Currently, the RSI is often used as a contrarian indicator to determine overbought and oversold conditions, but with this approach, I believe the RSI can instead function extremely well as a trend-following indicator. Whenever an uptrend occurs, the RSI inevitably rises, and when a downtrend occurs, the RSI inevitably falls. Therefore, by predicting the rise and fall of the RSI, it becomes possible to forecast what kind of trend is likely to develop.
In this indicator, the MACD calculated from the RSI is displayed, with the original RSI line plotted above it. Since the scales of the RSI and MACD are different, I originally wanted to provide a separate scale for the RSI on the left side. However, due to TradingView’s limitations, it seems quite difficult to display more than one scale in a single panel, so I had to give up on that. Instead, I ask that you mentally multiply the RSI values displayed on the right by 10—for example, 2.11 indicates 21.1%.
Additionally, as a bonus, I’ve included a feature that detects divergences. With these features, I believe this has become the most useful indicator when compared to existing RSI-based indicators. I hope you find it helpful in your trading.

RV - Relative Strength Index Buy/SellIntroduction
The RV - RSI B/S V1.2 indicator leverages the RSI to identify overbought and oversold conditions in the market. The RSI line color changes according to bullish, bearish, oversold, and overbought zones, helping users identify direction and avoid false trades. By plotting the RSI along with user-defined moving averages and Bollinger Bands, it offers a multi-faceted approach to analyzing market momentum.
Indicator Overview
The indicator RSI line color changes as per the bullish, bearish, oversold, and overbought zones. This helps users find out the direction and the zones. The oversold and overbought zones are colored to help users avoid false trades.
Trading Strategy
Long Trades (Bullish Setup):
Entry: A long trade is initiated when the RSI crosses from 60 up to 80.
Exit: Long trades are generally exited when the RSI is between 80 and 90.
Condition: No long trades are taken if the RSI exceeds 80.
Short Trades (Bearish Setup):
Entry: A short trade is initiated when the RSI crosses from 40 down to 20.
Exit: Short trades are generally exited when the RSI is between 20 and 10.
Condition: No short trades are taken if the RSI falls below 20.
RSI Color Coding and Interpretation
The RV - RSI B/S V1.2 indicator uses color coding to provide a visual representation of RSI values, making it easier to identify critical levels at a glance:
Green (RSI 60-80): Indicates a bullish zone where long trades can be considered.
Red (RSI > 80): Signals an overbought condition where long trades should be avoided.
Orange (RSI 20-40): Indicates a bearish zone where short trades can be considered.
Pink (RSI < 20): Signals an oversold condition where short trades should be avoided.
RSI Settings and Their Importance
RSI Length: The default length is set to 12, which is the standard period for RSI calculation. This setting can be adjusted to increase or decrease sensitivity.
Source: The source of the data for the RSI calculation is typically the closing price.
MA Type: Various moving averages can be applied to the RSI, including SMA, EMA, SMMA (RMA), WMA, and VWMA. Each type offers different smoothing properties and can be selected based on
trading preferences.
MA Length: The default length is set to 20, aligning with the RSI length for consistency.
Bollinger Bands: When using Bollinger Bands, the standard deviation multiplier is set to 2.0 by default, but it can be adjusted to suit different volatility conditions.
Disclaimer
This indicator provides valuable signals for potential trading opportunities based on RSI levels and moving averages. However, it is crucial to incorporate directional price action analysis to confirm signals and improve trading accuracy. The RV - RSI B/S V1.2 should be used as part of a broader trading strategy, considering other technical and fundamental factors.

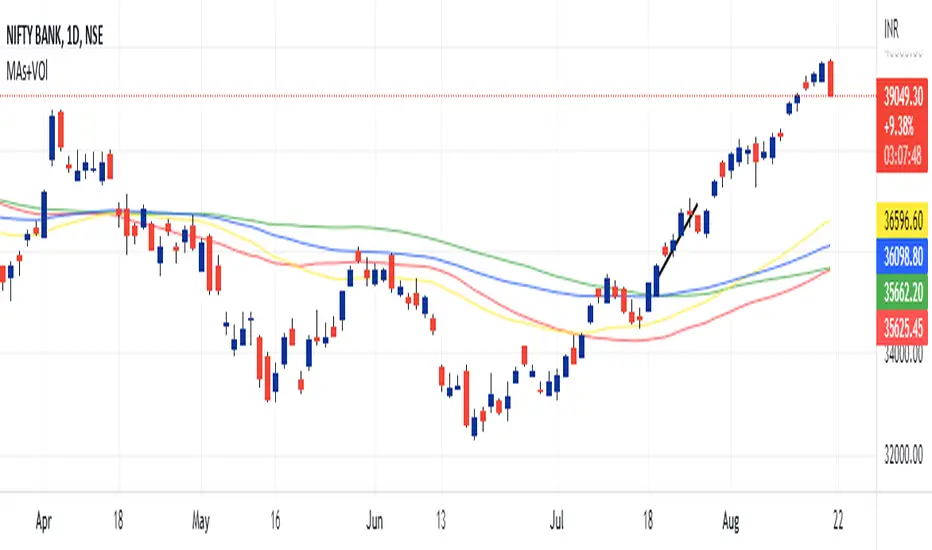
MAs+VOlIt a Combination of 4 Moving Averages.
2 Simple Moving Averages (50 SMA & 100 SMA)
2 Fast Moving Averages (50 EMA & 100 EMA)
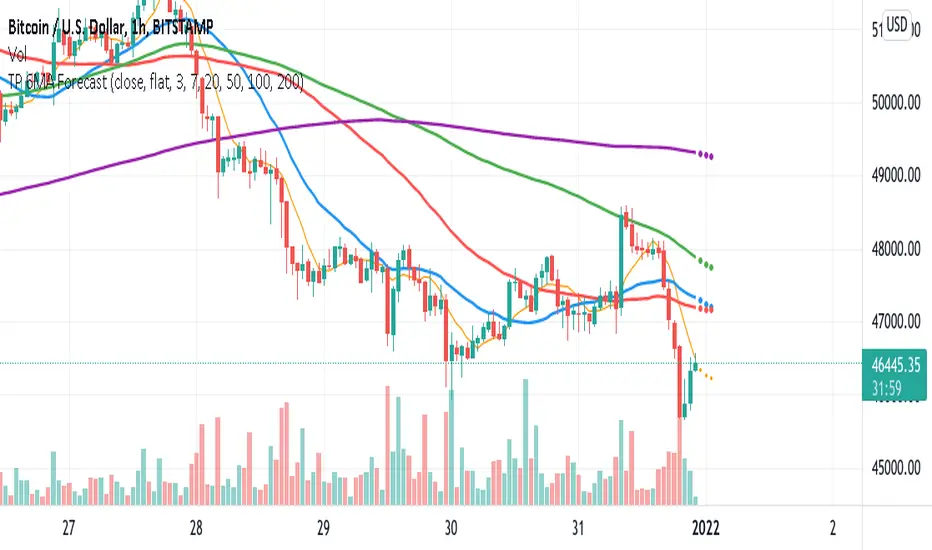
TargetPredictor 5MA ForecastThis indicator consists of five moving averages. 7, 20, 50, 100 and 200.
Moving averages usually represent dynamic supports or resistances and are very useful in trading.
In addition, this indicator predicts where these moving averages will be located three candlesticks ahead and predicts their projected movement.
I hope you enjoy it and enjoy using it.
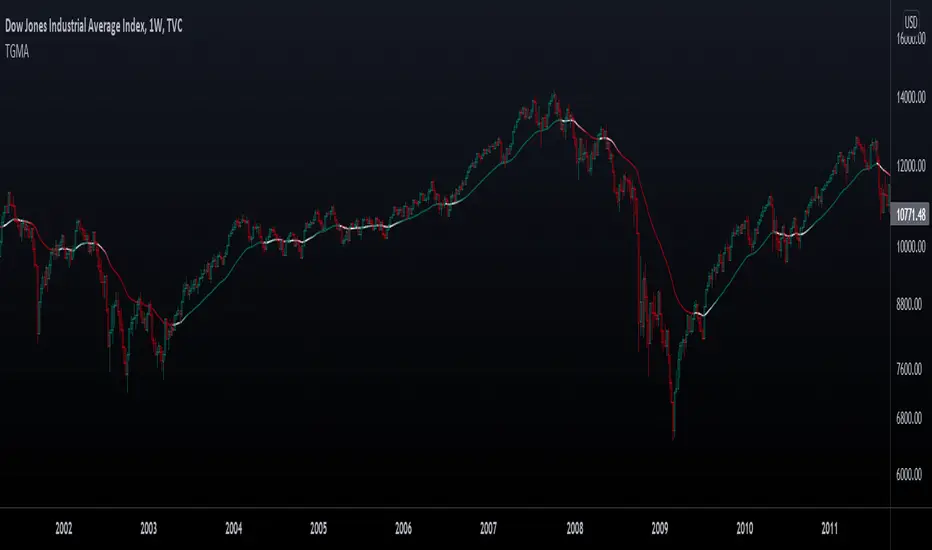
Trend Gradient Moving Average This moving average uses a gradient function which calculates the number of advances/declines of the moving average to change the intensity of the colors, meaning a longer trend in either direction will show a stronger color. You can choose 3 colors to build the gradient: a bullish, bearish & neutral/transition color. The number of steps chosen will change the speed of color change, with a lower number of steps meaning a faster transition and viceversa.
Furthermore, you can choose between many different types of moving averages:
-SMA (Simple Moving Average)
-EMA (Exponential Moving Average)
-RMA (Rolling Moving Average)
-WMA (Weighted Moving Average)
-HMA (Hull Moving Average)
-VWMA (Volume Weighted Moving Average)
-TMA (Triangular Moving Average)
Enjoy!
4 Time Frame Two EMAs Ribbon Comparison - Tom1traderI had seen something like this on metatrader but not here. Since I use TradingView and not metatrader had some fun with this. Indicates up or down for 4 chosen time Frames and as such helps to see the historical trend. Works best on daily or shorter charts because of load time.
User can choose the length of the two exponential moving averages used on each time frame or use defaults 9 and 15.
User can choose the 4 time frames defaults are (display from top to bottom) 5, 15, 60 and D.
Displays a column of 4 dots or circles for each bar of current chart the top being the shortest time frame.
If the faster exponential moving average is above the slower (uptrend) the dot is green else red.
This is similar (actually what I was originally shooting for but took extra time to figure out time frames on here) to another script of mine that has the same display method but uses a spaced set of Hull Moving Averages on one time frame, you choose the shortest length and the space increment between the averages. One may work better than the other for different markets or trading styles. The other one is here: Have fun trading and keep smiling!

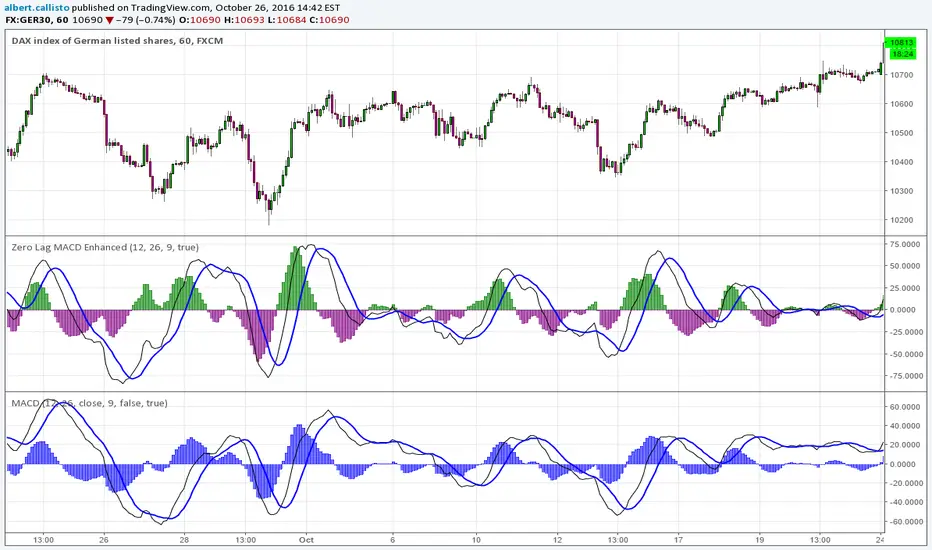
Zero Lag MACD Enhanced - Version 1.0*Zero Lag MACD indicator - Enhanced version 1.0*
Based on ZeroLag EMA - see Technical Analysis of Stocks and Commodities, April 2000
Original version by user Glaz. Thanks ! (see at the end of this description).
Tweaked by Albert Callisto
Displayed components:
Fast and slow "zero lag" moving averages
Histogram showing delta between the two moving averages
You can choose between SMA or EMA for the moving averages. They give slightly different results. Glaz had used SMA instead of EMA. Most "zero MACD" scripts are based upon EMA.
Usage is similar to the classic MACD and it can be integrated in an existing strategy, you will notice the crossing occurs earlier.
This is the original version by Glaz:
VHX EMA 135/315📈 EMA 135/315 Cross Strategy – Your Trend Compass with Smart Confirmations
🔍 Core Idea
The EMA 135/315 Cross strategy is a trend-following system.
It tracks two moving averages:
EMA 135 → the “fast” line that reacts to short-term price moves
EMA 315 → the “slow” line that reacts to the bigger trend
When the fast EMA crosses above the slow EMA → market momentum is turning up → BUY signal 🟢
When the fast EMA crosses below the slow EMA → momentum is turning down → SELL signal 🔴
This gives you a clear entry trigger — no guessing, no overcomplication.
✨ On Your Chart
BUY/SELL Arrows
🟢 Green arrow = bullish cross → trend turning up
🔴 Red arrow = bearish cross → trend turning down
Trend Info Panel (Top Left)
Current Trend: BUY / SELL / Neutral
Last Cross: how many bars ago it happened
EMA Gap in %: measures the strength of the trend
Status: “Approaching” if EMAs are getting close → possible cross soon
Automatic TP/SL Levels
📈 TP line (+2% from entry)
📉 SL line (–0.5% from entry)
Saves time — you instantly see your target and protection
EMA Distance Meter
Big % gap = strong trend momentum 🚀
Small % gap = weak or sideways market ⚠️
Real-Time Alerts
You get notified when a cross happens, even if you’re away from the screen
🧠 The Logic Behind It
The EMA 135 reacts faster → it reflects short-term momentum
The EMA 315 moves slower → it reflects the main trend
When the fast EMA overtakes the slow EMA: short-term strength now aligns with the long-term trend → higher probability of a sustained move
The gap % tells you how strong the alignment is — large gap = cleaner moves, small gap = market in transition
“Approaching” status warns that the EMAs are converging, which often happens before a reversal
📊 Boosting the Strategy with Volume Analysis
The EMA cross is a strong trigger, but volume confirms the quality of the move:
High Volume + Cross → more reliable signal, as strong market participation is pushing the trend
Low Volume + Cross → caution, the move might be weak or a false breakout
💡 Tip:
Check the volume histogram or a volume-based indicator (e.g., Volume Profile, OBV).
On a BUY signal: volume should spike above the recent average.
On a SELL signal: watch for strong selling volume bars.
📍 Adding Support & Resistance for Precision
Support and resistance levels help filter out bad trades and optimize entries:
Best BUY setups:
EMA 135 crosses above EMA 315 near a known support zone
Bonus if volume confirms the move
Avoid buying directly into a strong resistance
Best SELL setups:
EMA 135 crosses below EMA 315 near a known resistance zone
Bonus if selling volume is strong
Avoid selling directly into a major support
💡 Use tools like horizontal lines, previous highs/lows, and Volume Profile nodes to spot these zones.
📈 Best Usage Practices
Timeframes
Lower timeframes (1m–5m) → more signals, but more noise → best for scalping with extra filters
Always Combine With Confirmation
EMA Cross = Trigger
Volume spike = Confirmation
S/R zone in your favor = High-probability setup
Manage Risk
Start with the built-in TP/SL
Adjust SL if volatility is higher than usual
Consider trailing stop once price moves in your favor
Avoid Sideways Markets
If EMA gap % is very small and crosses happen often → stand aside until a clear direction forms
Use Alerts
Set alerts for BUY & SELL crosses so you never miss a setup
In short:
This isn’t just an EMA cross indicator — it’s a trend system with built-in risk management, strength measurement, and pre-trade preparation. Combine it with volume confirmation and smart use of support/resistance, and you turn a simple signal into a high-probability trading edge.

Brian Shannon 5-Day MA BackgroundBrian Shannon 5-Day Moving Average with Dynamic Background Fill
OVERVIEW
This indicator implements Brian Shannon's renowned 5-Day Moving Average methodology from his acclaimed work "Technical Analysis Using Multiple Timeframes." The indicator provides instant visual clarity on short-term trend direction and momentum, making it an essential tool for swing traders and active investors.
KEY FEATURES
• True 5-Day Moving Average: Dynamically calculates the correct period across all timeframes (1min, 5min, 15min, 1H, etc.)
• Visual Price-to-MA Relationship: Color-coded fill between price and the moving average
- Green Fill: Price is above the 5-day MA (bullish short-term momentum)
- Red Fill: Price is below the 5-day MA (bearish short-term momentum)
• Multi-Timeframe Compatible: Works seamlessly on any chart timeframe while maintaining the true 5-day calculation
BRIAN SHANNON'S STRATEGIC APPLICATION
Primary Uses:
1. Trend Identification: Quickly identify short-term momentum shifts
2. Dynamic Support/Resistance: The 5-day MA acts as a moving support level in uptrends and resistance in downtrends
3. Entry Signal Confirmation: Look for pullbacks to the 5-day MA as potential entry points in trending stocks
4. Multi-Timeframe Analysis: Essential component of Shannon's multiple timeframe approach
Perfect Combination with:
• AVWAP (Anchored Volume Weighted Average Price): Use together to identify high-probability setups where price is above both the 5-day MA and AVWAP
• Longer-term Moving Averages: Combine with 20-day and 50-day MAs for complete trend analysis
• Volume Analysis: Confirm 5-day MA signals with volume patterns
TRADING APPLICATIONS
For Swing Traders:
• Bullish Setup: Price above 5-day MA + above AVWAP + above longer-term MAs = Strong uptrend
• Bearish Setup: Price below 5-day MA + below AVWAP + below longer-term MAs = Strong downtrend
• Entry Timing: Use pullbacks to the 5-day MA as entry opportunities in the direction of the primary trend
For Day Traders:
• Quick visual confirmation of intraday momentum
• Dynamic support/resistance levels for scalping opportunities
• Clear trend bias for directional trades
WHY THIS INDICATOR WORKS
Brian Shannon's approach emphasizes that the 5-day moving average represents the short-term sentiment of market participants. When price is consistently above this level, it indicates buyers are in control of short-term price action. Conversely, when price falls below, it suggests selling pressure is dominating.
The visual fill makes it immediately obvious:
• How far price is from the 5-day MA
• The strength of the current short-term trend
• Potential areas where price might find support or resistance
BEST PRACTICES
1. Never use in isolation - Always combine with longer timeframe analysis
2. Volume confirmation - Look for volume expansion on moves away from the 5-day MA
3. Multiple timeframe approach - Check higher timeframes for overall trend direction
4. Combine with AVWAP - Most powerful when both indicators align
INSTALLATION NOTES
This indicator automatically adjusts for any timeframe, ensuring you always get a true 5-trading-day moving average regardless of whether you're viewing 1-minute or hourly charts.
Based on the technical analysis methodology of Brian Shannon, author of "Technical Analysis Using Multiple Timeframes"
Hybrid Adaptive Momentum Average (HAMA)Hybrid Adaptive Momentum Average (HAMA)
Imagine you want a moving average line on your chart that's usually smooth but gets really quick to follow the price when the market suddenly makes a big, fast move. That's what HAMA tries to be.
Here's the simple breakdown:
Slightly Better Starting Price: Instead of just using the closing price, HAMA first creates a slightly "smarter" starting price by giving a bit more importance to the very latest prices (like a quick WMA).
Checks Market Speed (Momentum): It then looks at how fast this "smarter price" has been moving recently.
-If the price is shooting up or down quickly, HAMA knows there's strong momentum.
-If the price is just drifting sideways, momentum is low.
Adjusts Its Own Speed: Based on this momentum:
-Strong Momentum (Fast Market): HAMA makes itself "faster." This means its line will stick closer to the current price and react quickly to changes. (It uses a shorter "period" internally).
-Weak Momentum (Slow/Choppy Market): HAMA makes itself "slower." Its line will be smoother and less jumpy, ignoring minor wiggles. (It uses a longer "period" internally).
-Draws the Line: Finally, it calculates and draws the moving average line using this automatically adjusted speed.
Why "Hybrid"?
It's called "hybrid" because it takes bits and pieces of ideas from several standard moving averages:
-Like an EMA, it's built to be responsive.
-Like a WMA, it initially focuses on recent prices.
-Inspired by the HMA, it tries to be smart about detecting momentum to adjust itself.
In a Nutshell:
The HAMA is a custom moving average that tries to be the best of both worlds: smooth in calm markets and quick to react in fast-moving markets by automatically changing its own calculation speed based on price momentum.

Responsive Moving Average with Trend Detection - MissouriTimThis indicator calculates a responsive moving average (RMA) that dynamically adjusts its sensitivity based on market volatility. This indicator is more responsive that SMAs, EMAs, WMAs, and HMAs. Here's how it functions:
Dynamic Length Adjustment: Utilizes the Average True Range (ATR) to adjust the length of the moving average. In times of increased volatility, the length decreases to make the average more responsive to price changes, and in quieter markets, it increases to reduce noise.
Responsive and Smoothed Moving Averages:
Responsive EMA: An initial Exponential Moving Average (EMA) is calculated with a dynamically adjusted length for responsiveness.
Smoothing: A secondary layer of smoothing is applied to this responsive EMA to further smooth out price fluctuations.
Trend Detection:
Detects trends by comparing the current smoothed EMA with its previous values:
Uptrend is identified when the current smoothed EMA is higher than the last two periods.
Downtrend is recognized when the current smoothed EMA is lower than the last two periods.
Consolidation occurs when neither an uptrend nor a downtrend is present.
Visual Representation:
The moving average line changes color:
Green for an uptrend.
Red for a downtrend.
Orange for consolidation.
Significant Trend Labels:
Labels are displayed when there's a significant change in the moving average:
Uptrend Labels appear when the EMA increases by more than the user-defined "Uptrend Label on % Change" threshold, placed at the high of the bar with green background.
Downtrend Labels are shown when the EMA decreases by more than the "Downtrend Label on % Change" threshold, positioned at the low of the bar with a red background.
Users can enable or disable these labels, and the thresholds for labeling uptrends and downtrends can be adjusted separately to match market conditions or user preferences.
This indicator is tailored for traders needing a moving average that adapts to market dynamics while providing clear visual feedback on significant trend changes via color-coded lines and labels.
